Brief side note:
If you're ever in the market for Likes, Followers, Retweets, etc. for yourself, a friend or your latest project - be sure to get them from us right here on foundation.bz - Thanks =)
We snapped off a copy of The Best Bitcoin Chart and cleaned it up to perform a more detailed technical analysis of the BTC price and attempt to predict where we’re heading next. It goes without saying that this speculative and simply one man’s viewpoint. You should never make any investment decisions without doing your own due diligence.
Click “Full Screen” for a ↓ better view
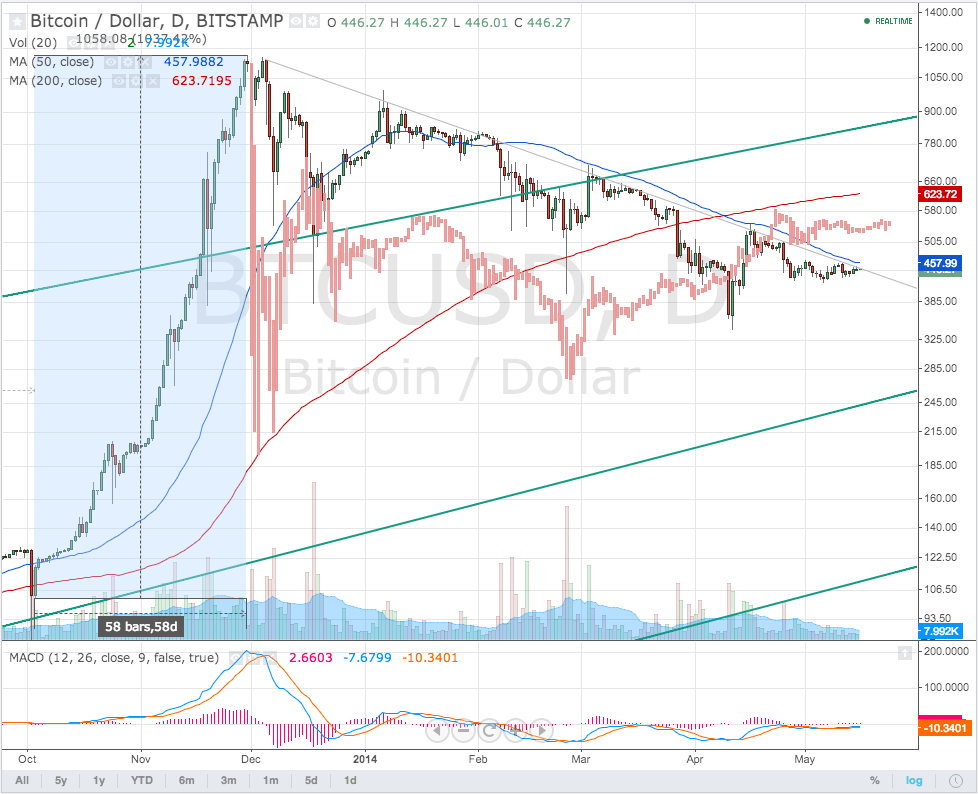
The bull market in BTC can be broken down into 3 “Legs” each of which have been measured on the chart in blue. Each leg begins at the end of a plateau and lasts 2-3 months of growth anywhere between +220% and +1,869%. We see that Leg 1 lasted 81 days and resulted in a gain of 223%. After a steep decline and plateau of 142 days we began Leg 2 which lasted 94 days and resulted in a gain of 1869%. After yet another steep decline and plateau which lasted 176 days we reach Leg 3 which lasted 58 days and resulted in a gain of 1037%.
Armed with this information, we can run some analysis to see if anything jumps out at us. For example, look what happens when we overlay the days following the peak of Leg 2 with the peak of Leg 3:

Seeing a lot of similarities but a few things stand out:
- Crazy how the ghost bars (in red) use the current 200 day Moving Average as support and then resistance. Almost perfectly. The ghost bars look bullish here LOL
- Where the ghost bars the real bars is when Chinese exchanges halted deposits. This moment may have been a bigger setback than we realize.
- If Leg 4 is to begin in the exact same number of days as it took for Leg 3 to start, Leg 4 would be starting in 8 days on 5/24/14. Although, the plateau between Leg 1 and Leg 2 took 142 days meaning the time expanded by 23.9% between Leg 2 and Leg 3. Another 23% expansion puts Leg 4 starting 218 days from the peak on 7/6/14.
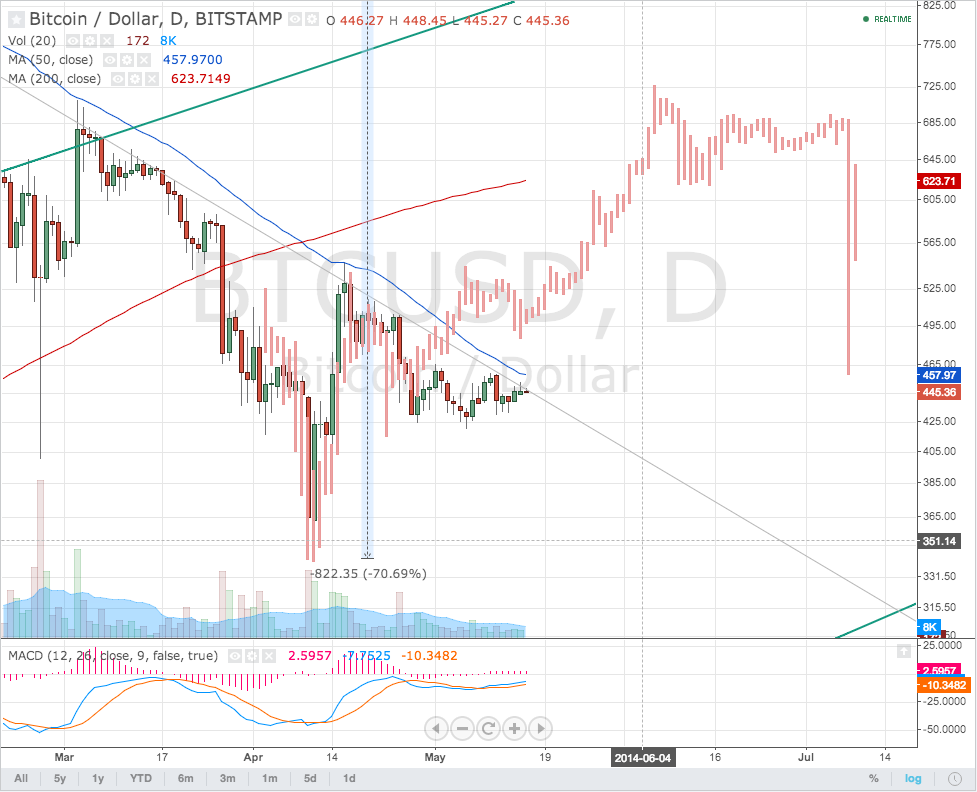
We can also take a closer look at the plateaus where we’ll see that each of them form a “V” shape with a fairly clear bottom. The drawdown between Leg 2 and Leg 3 was -75% and the low of the plateau we’re currently experiencing results in a drawdown of -71%. If we overlay the bottoms of each plateau we get the following:

Beyond the “V” shape itself looking very similar, the month that follows tells a different story. Notice how well defined the downward sloping trendline is in the plateau we’re currently experiencing. It’s practically guiding the price straight for the green trendline. In fact I actually believe the ghost bars from Leg 3 correlate nicely with the amount of time that will pass before those trendlines collide on 7/16/14. So, if these ghost bars are telling us anything, it’s that Leg 4 will begin on 7/9/14.
We’ll have to wait and see whether we ride the current trendline all the way to the green trendline at around $315. However, based on our analysis it’s fair to say that the week or so starting 7/6 is a pretty good guess as to when Leg 4 will begin – if at all.


